

Productivity monitoring built around trends, not snapshots
Peak hours, seasonal patterns and team benchmarks show the shape of your output over time.
A productivity figure for one week tells you almost nothing. Worktivity concentrates on the longer arc: when your teams are genuinely at their best, how output moves across a quarter, and which teams have found something the others have not.
14-day free trial · No credit card required
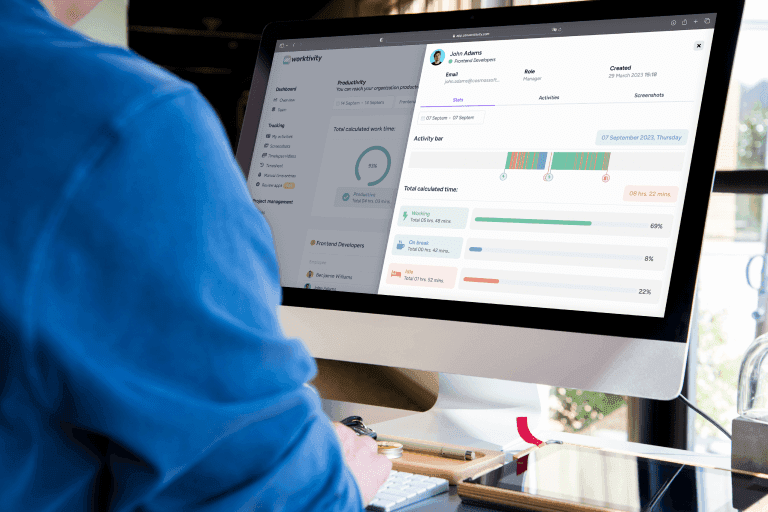
What gets monitored
Eight views of team productivity, weighted toward pattern and trend rather than the current instant.
Productivity dashboards
Team and department views with trend lines, comparisons and drill-down, refreshed continuously rather than compiled for a meeting.
Activity analysis
Application time, site usage and active work broken down far enough to explain a productivity figure rather than merely report it.
Peak performance hours
When your teams do their best work, by hour and by weekday. Scheduling demanding work against that curve is one of the cheapest gains available.
Trends and patterns
Movement across weeks, quarters and seasons, so a dip can be recognized as normal seasonality rather than treated as a crisis.
Team productivity metrics
Consistent definitions applied across teams, which is the precondition for any comparison being meaningful.
Goal management
Targets set at team level with progress tracked automatically, so goals stay live between review cycles.
Reporting that covers the workday
Prebuilt and custom reports across productivity, activity, trends and comparisons, exportable for board and review packs.
Optimization insights
Specific, ranked recommendations derived from the trend data, showing which change is likely to move the number furthest.
What monitoring at team level gives you
Five things that only become visible when you look at the pattern rather than the day.
Visibility at the right altitude
Individual, team and organization views of the same data, so a conversation can move between levels without switching tools or definitions.
Optimization targets, ranked
Not every inefficiency is worth fixing. Trend data shows which ones are actually costing you and which are noise.
Schedules that follow the curve
Peak-hour analysis lets you put demanding work where the capacity actually is, which is rarely where the calendar has put it.
Change you can verify
A measured baseline makes it possible to say whether a process change worked, which is the difference between improvement and activity.
Resource allocation with evidence
Capacity decisions get made against measured demand instead of against whoever argued most persuasively.
How Worktivity approaches productivity monitoring
Four choices that determine whether monitoring produces insight or just charts.
Evidence-based management
Quantified productivity replaces the anecdote as the unit of argument, which changes what decisions are possible.
Continuous, not periodic
Ongoing measurement keeps the resolution needed to link a cause to an effect. Monthly snapshots destroy exactly that resolution.
Benchmarking that is like-for-like
Comparison between teams, departments and time periods, using definitions configured once and applied everywhere.
A planning horizon, not just a record
Trend and seasonality analysis makes the data usable for the next quarter rather than only for explaining the last one.
What customers measure
Typical results after two quarters of continuous productivity monitoring.
15-25% productivity gain
Largely from scheduling demanding work into measured peak hours and removing the friction the trend data exposed.
Better resource utilization
Capacity matched to measured demand rather than to historical headcount allocation.
Stronger performance management
Objective productivity data makes evaluation both fairer and considerably faster to prepare.
Who monitors productivity this way
Sectors where output varies enough that the trend matters more than the daily figure.
Knowledge-worker organizations
Output resists direct counting, so time-use patterns become the most reliable available proxy.
Remote & hybrid teams
Consistent measurement regardless of location is the only way to compare distributed teams honestly.
Project-based companies
Productivity by project phase is where estimation errors are actually located, and where they can actually be fixed.
Technology & software development
Fragmented focus time is the dominant productivity cost in engineering, and it is invisible without measurement.
Consulting & professional services
Utilization trends drive both profitability and staffing decisions, and both need more than a monthly number.
Marketing & creative agencies
Creative output is inherently bursty. Trend analysis distinguishes a normal trough from a genuine problem.
Related Worktivity guides
Neighboring topics, in case you arrived here from a slightly different question.
Remote Employee Monitoring
Visibility across distributed teams, with privacy settings that make it survivable.
Learn moreTime Tracking Software
Automatic hours, project allocation and billable-time capture without timesheets.
Learn moreWorkforce Analytics Software
Strategic workforce data: retention risk, capacity forecasting and benchmarking.
Learn more
Productivity monitoring software questions
Common questions about monitoring productivity at team and organization level.
What is productivity monitoring software?
Software that measures how work time converts into output and presents the result as dashboards, trends and benchmarks. It is aimed at team and organizational patterns rather than individual policing.
How does productivity monitoring software work?
Activity is recorded continuously by a desktop agent, classified against role-specific definitions of productive work, and rolled up into metrics, trends and comparisons.
What metrics does it track?
Active work time, application and site usage, productivity scores, peak performance hours, consistency, workload distribution and goal attainment.
How is it different from activity monitoring?
Activity monitoring records what happened on the machine. Productivity monitoring interprets it, classifying activity by role, scoring it and tracking how it moves over time.
Can it set and track productivity goals?
Yes, at individual and team level, with progress calculated automatically from the measured data rather than entered by hand.
How much does productivity monitoring software cost?
$3.99 per user per month with a 14-day free trial and no card required to begin.
How does it improve team performance?
Mainly by locating friction and by aligning demanding work with measured peak hours. Both are structural changes rather than requests for more effort.
How is productivity monitoring data protected?
Productivity records are encrypted in transit and at rest, access to team and individual views is role-scoped, retention is configurable, and the platform is operated in line with GDPR.
See the shape of your team's productivity
Two weeks of measurement is enough to reveal your peak hours and your largest single source of friction.
14-day free trial · No credit card required